

In This Lesson You Will Learn About The Product Performance Report
The purpose of this lesson is to walk through the Product Performance Report in Google Merchant Center.
Exploring The Product Performance Report In The Google Merchant Center
Overview & Step By Step Instructions
The Product Performance Report provides insights and data regarding the performance of your products on Google Shopping Ad. The Performance Report offers detailed information on how your products are performing in terms of impressions, clicks, conversions, and other relevant metrics.
To track your product performance in Google Merchant Center, you can follow these steps:
- Access your Google Merchant Center account: Sign in to your Google Merchant Center account using your credentials at merchants.google.com.
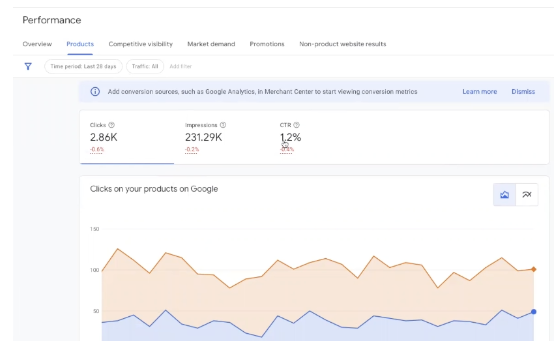
- Navigate to the "Performance" section: Once logged in, click on the "Performance" tab or menu option in the navigation menu. This section provides an overview of your product performance data.
- Customize the date range: Select the desired date range to analyse your product performance. You can choose a specific timeframe or use predefined options like "Last 7 days," "Last 30 days," or "Last 90 days."
- View performance metrics: The Performance section displays various performance metrics such as impressions, clicks, click-through rate (CTR), conversions, conversion rate, revenue, and cost of sales (COS). You can explore these metrics to understand how your products are performing.
- Analyse data by product attributes: You can further analyse the data by using the available filters and segmentation options. For example, you can filter data by product category, brand, custom labels, or specific products to gain deeper insights into their performance.
- Use the competitive visibility report to compare your visibility across Shopping ads and free listings based on displayed impressions on product. Understand who your competitors are and how you stack-rank against competitors and top merchants over time.
- Set up additional tracking: For more advanced tracking and insights, consider integrating Google Analytics with your Google Merchant Center account. This can provide additional data and analysis capabilities for your product performance.
Remember to regularly review and track your product performance in the Google Merchant Center to identify opportunities for improvement, optimize your product listings, and enhance your advertising strategy.
Metrics in Product Performance Report
The report provides data on various performance metrics such as:
-
Impressions: The number of times your product was shown to users in search results or on partner websites.
-
Clicks: The number of times users clicked on your product listing.
-
Click-through rate (CTR): The percentage of impressions that resulted in clicks.
-
Conversions: The number of completed actions or purchases generated by your product listings.
-
Conversion rate: The percentage of clicks that resulted in conversions.
-
Revenue: The total revenue generated from sales of your products.
-
Cost of sales (COS): The ratio of advertising spend to revenue, indicating the efficiency of your advertising campaigns.
The Product Performance report in Google Merchant Center is a valuable tool for monitoring and assessing the performance of your product listings. This report provides comprehensive data and insights that enable you to evaluate the effectiveness of your advertising efforts and make informed decisions to optimize your product campaigns.
Within the Product Performance report, you can track metrics such as impressions, clicks, click-through rate (CTR), conversions, conversion rate, revenue, and cost of sales (COS). These metrics offer key indicators of how your products are performing and help you identify areas for improvement. By analysing this data, you can refine your product feed, optimize titles and descriptions, adjust bids, and enhance your overall advertising strategy.
Additionally, the report allows you to segment and filter data based on product attributes, such as category, brand, or custom labels. This segmentation provides deeper insights into the performance of specific product groups, enabling you to allocate resources effectively and focus on high-performing products.
By regularly reviewing the Product Performance report, you can track trends, measure the impact of optimizations, and drive continuous improvement in your product listings, ultimately maximizing your advertising ROI and enhancing your online sales.
The Product Performance report in Google Merchant Center provides information on various performance metrics related to your product listings. It includes data on impressions, clicks, click-through rate (CTR), conversions, conversion rate, revenue, and cost of sales (COS). This data helps you understand how your products are performing in terms of visibility, user engagement, and sales.
Yes, you can customize the date range in the Product Performance report. You have the flexibility to select a specific timeframe or use predefined options such as "Last 7 days," "Last 30 days," or "Last 90 days." This allows you to analyse product performance over different periods and track trends over time.
Yes, you can export the Product Performance report from Google Merchant Center. The platform offers options to export the data as a CSV or Excel file. This allows you to further analyse the data, share it with stakeholders, or integrate it into your own reporting systems.