In This Lesson You Will Learn How To Navigate the GA4 UI
The purpose of this guide is to show you how to navigate the reports page, filter, and create custom reports in the GA4 interface.
How to Use the Google Analytics 4 (GA4) Interface
Step by Step:
How to access the reports page in GA4?
- Sign in to your Google Analytics account (https://analytics.google.com) and select the GA4 property you want to access the reports for.
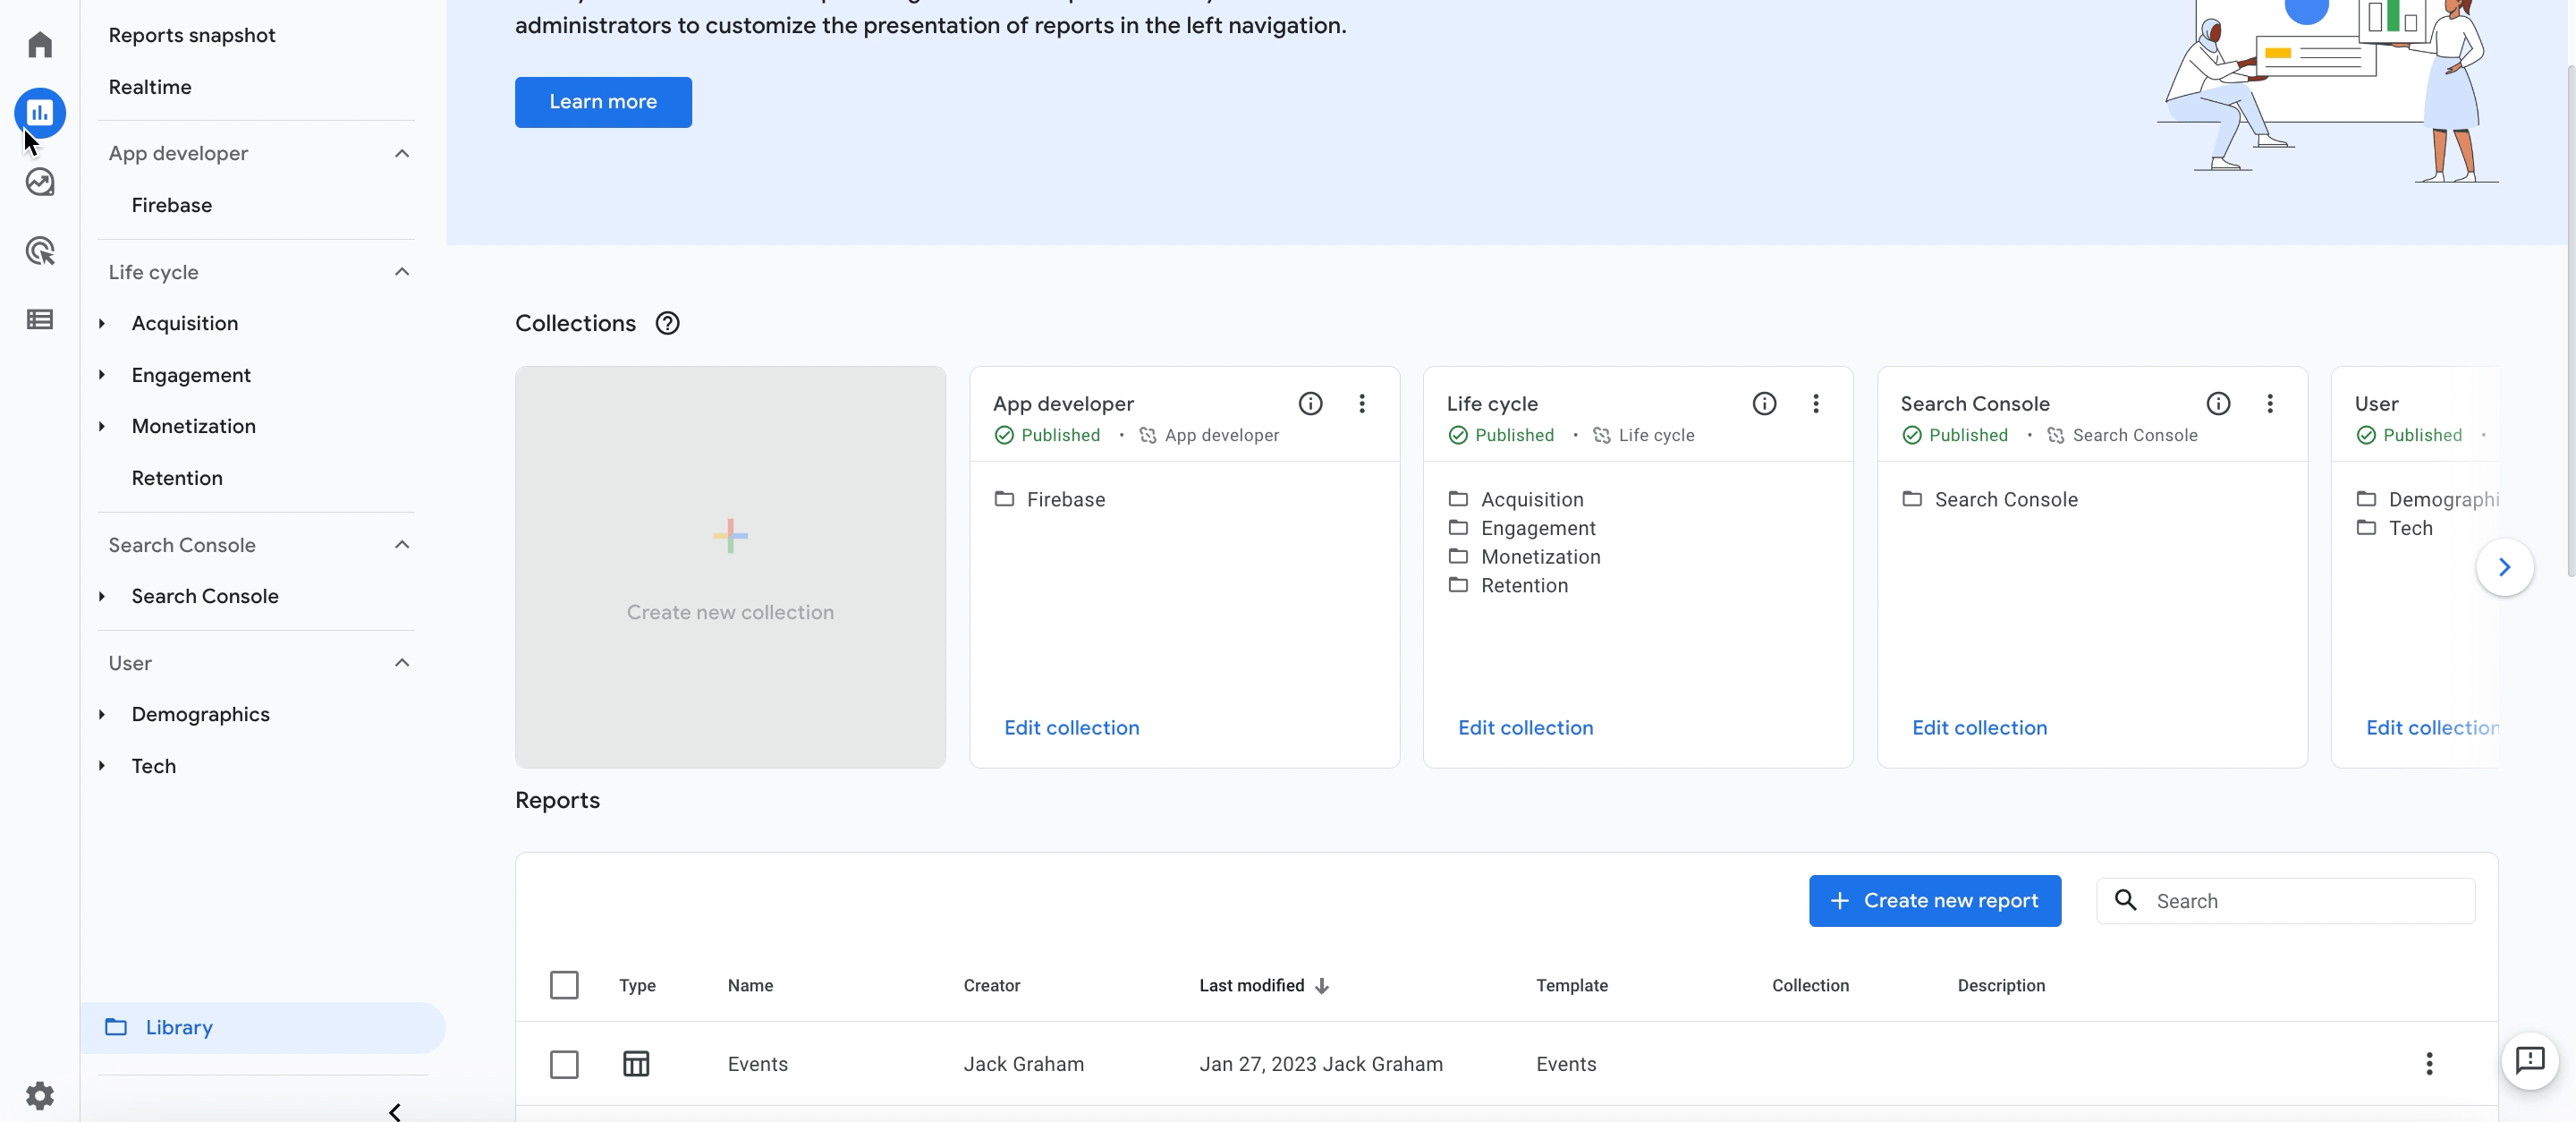
- From the home page, in the left-hand navigation menu, click on the "Reports" tab to open the Reports section of GA4.
- Within the Reports section, you will see various report options organized into different categories such as Engagement, Acquisition, Monetization, and more.
- Within each report category, you will find default reports that provide insights into different aspects of your data.
Different types of reports
- Reports Snapshot: Overview of metrics, highlighting key trends and patterns for campaign sources and user acquisition, enabling quick assessment of website performance.
- Real-Time Report: GA4's real-time report provides up-to-date user activity information including location, page views, and event interactions within the last 30 minutes.

How to create custom reports in GA4?
- Inside GA4, navigate to the desired report or go to the "Customization" tab and click on the "Customize" or "Customize report" button.
- In the customization interface, modify the metrics or dimensions by removing or adding specific ones.
- Click on "Apply" or "Save" to save the changes made to the report.
- Optionally, give the report a meaningful name and save it for future use.
- Modify visualizations and save the customized report for future use which will be shown in the "Customization" or "Saved reports" section for easy access.
How to filter reports in GA4?
- Inside GA4, open the desired report and look for the "Filter" or "Apply Filters" option.
- Specify the filters you want to apply, such as selecting a specific dimension or metric, or using a search term.
- Apply the filters to the report to display the filtered data.
- To remove a filter, find the "Remove Filter" or "Clear Filters" option and click on it.
Generating reports in GA4 is a crucial step in understanding your website's performance. By accessing the reports section in the GA4 interface, you can gain valuable insights into user behavior, traffic sources, and key metrics. Utilize the customizable features, such as adjusting date ranges and applying filters, to generate comprehensive reports that empower data-driven decision-making for optimizing your online presence.
GA4 introduces a more event-based model compared to the pageview-centric approach of Universal Analytics. It provides expanded tracking capabilities, cross-device measurement, and deeper integration with Google Ads and other Google products.
Yes, GA4 offers seamless integration with Google Ads. By linking your GA4 property to Google Ads, you can view campaign performance data, track conversions, and optimize your advertising efforts based on valuable insights.
Getting started with GA4 is easy. Create a new GA4 property in your Google Analytics account, set up tracking on your website, and start exploring the default reports to gain insights into your data.